


AquaINFRA News
The colours of water: Optical water types across aquatic ecosystems
November 11th, 2026
Reading the colour of the sea
"I have always been fascinated by the colors of water and the remarkable range they can display, shifting from deep blue and turquoise to green and brown," says Dr. Martin Hieronymi, a marine scientist at Helmholtz-Zentrum Hereon in Germany.
Some waters go even further. "Some water bodies exhibit colors that appear almost unnatural, including bright green, purple, or magenta, often as a result of unusual algal communities."
For AquaINFRA, Martin and his colleagues use those colours to describe the waters of the Baltic Sea from space. From orbit, a satellite records the light coming back off the water. Its colour says something about what is in the water, which in turn decides how the rest of the image should be read.
Ten kinds of water
The Hereon team sorts the region's water into ten optical water types. The classification gives a first picture of what the water contains, and it decides which algorithm should be used to estimate those contents.
The team chose plain names so the classes are easy to read: blue ocean waters, phytoplankton-dominated waters, bright-brown sediment-dominated waters and dark-brown waters rich in coloured dissolved organic matter (CDOM). One class covers the bright turquoise water of coccolithophore blooms, where tiny calcium carbonate plates scatter light strongly. "These events are often strikingly visible in satellite imagery," Martin says. They also show why the classes matter. Conventional chlorophyll algorithms "generally perform poorly and are therefore not appropriate for these conditions."
Working on the Galaxy version taught him more about his own tool. "I have learnt a lot about our tool for optical water type classification, including that it is intuitively based on three spectral features and that the system can be effectively applied to a wide variety of band configurations and thus to a wide range of satellites or measurement data." He hopes that gets noticed. The water types, he says, "apply to all natural bodies of water, from lakes and rivers to coastlines and the sea."
One cloud over the ship
A satellite estimate is only as good as the measurements used to check it. That means matching a pixel to a sample taken in the water, which is harder than it sounds.
Tides, currents and blooms keep the water moving. The satellite usually passes around noon, and a sample taken hours apart may describe different water. Research cruises have to be planned well in advance around permits and vessel schedules, so catching a bloom at its peak is mostly luck.
Martin's two biggest disappointments make the point. "Despite systematically surveying sea areas, we passed right past a dense algal bloom (visible on the satellite image)," he says. And on another occasion: "The measurements at sea were perfect under clear sky conditions, yet the satellite image shows exactly one cloud over our ship's position, so there's no match-up."
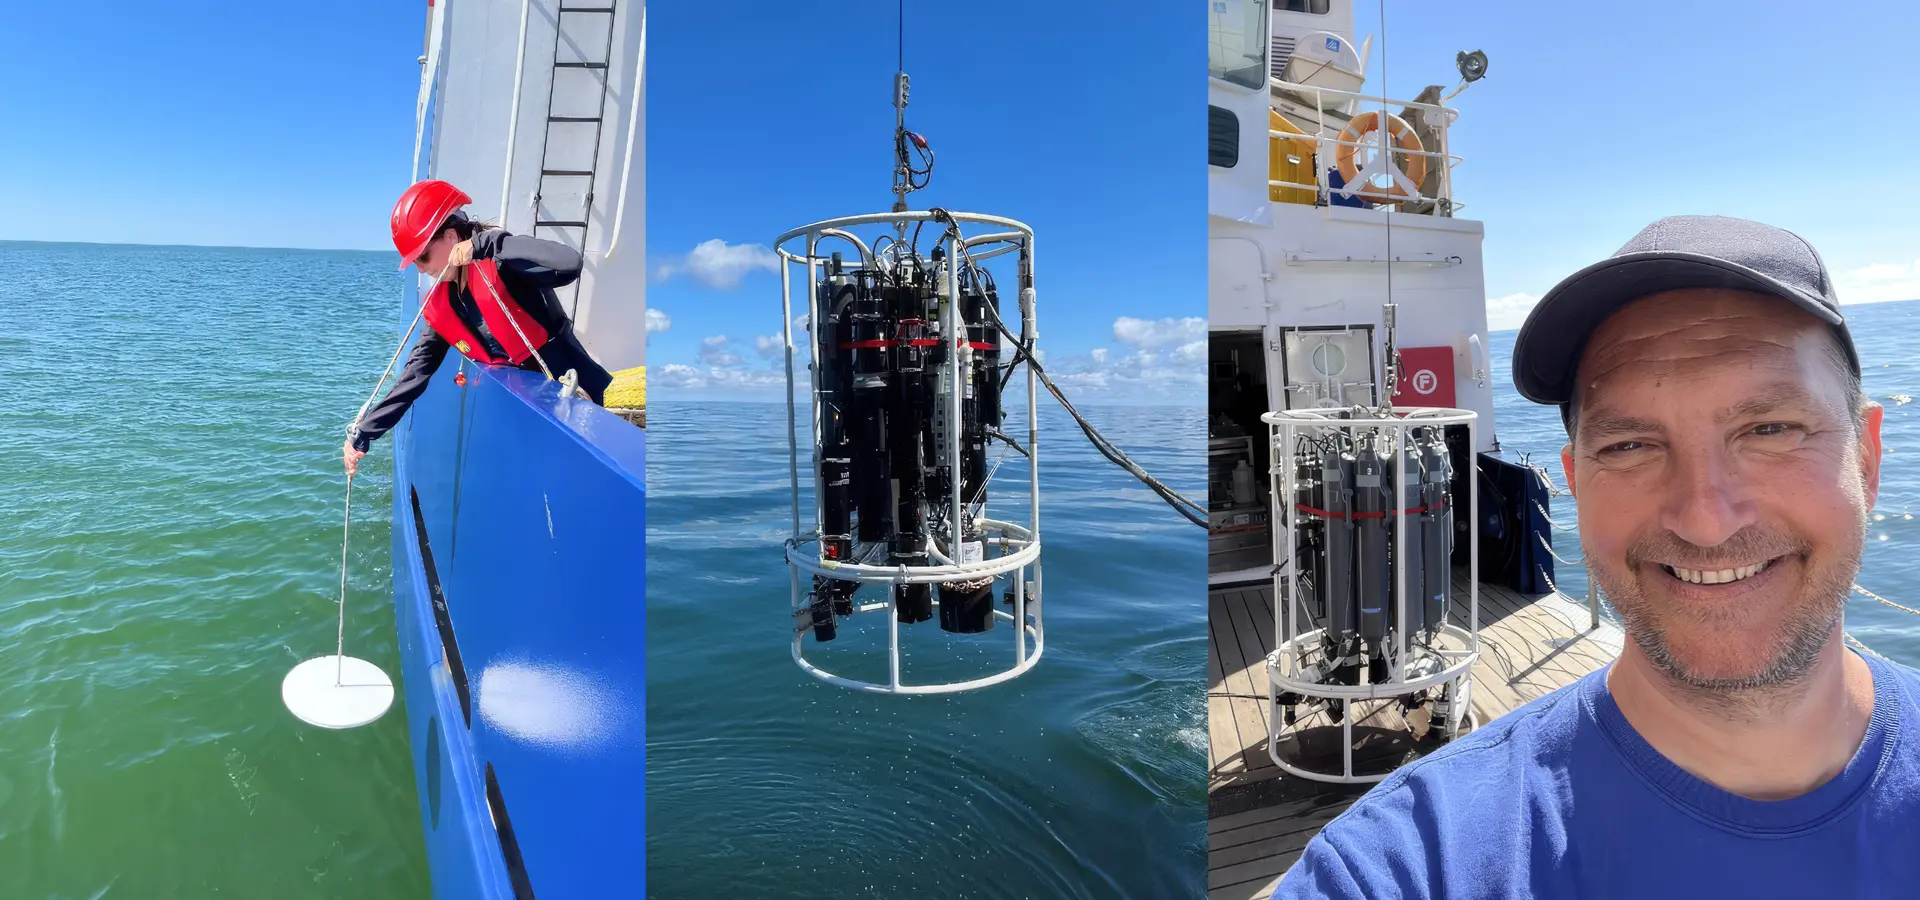
Left to right: Deployment of the Secchi disk, CTD water sampler and instrument frame and Martin Hieronymi at sea. Photos by M. Hieronymi.
The in-situ data brings problems of its own. Often, methods are poorly described, and sometimes not suited to the job. "Data may be FAIR, but this usually says little about the level of confidence in them," he says. Compare uncertain sea measurements with even more uncertain satellite data, and the result can be "wild scattered point clouds with no clear relationship between them, which can be super disappointing."
Blooms, beaches and carbon
Spotting algal blooms from space is only the start, Martin says. "An interesting question is at what point concentrations of cyanobacteria pose a health risk to people swimming in the sea."
Satellite data can pick out potentially harmful blooms early and follow how they develop. For coastal managers, that means sampling on the ground can be better targeted and warnings for individual stretches of beach can go out in good time. On the German Baltic coast, where summer tourism matters a great deal to the economy, reliable information helps strike a balance "between protecting public health and avoiding unnecessary restrictions on bathers and tourist activities."
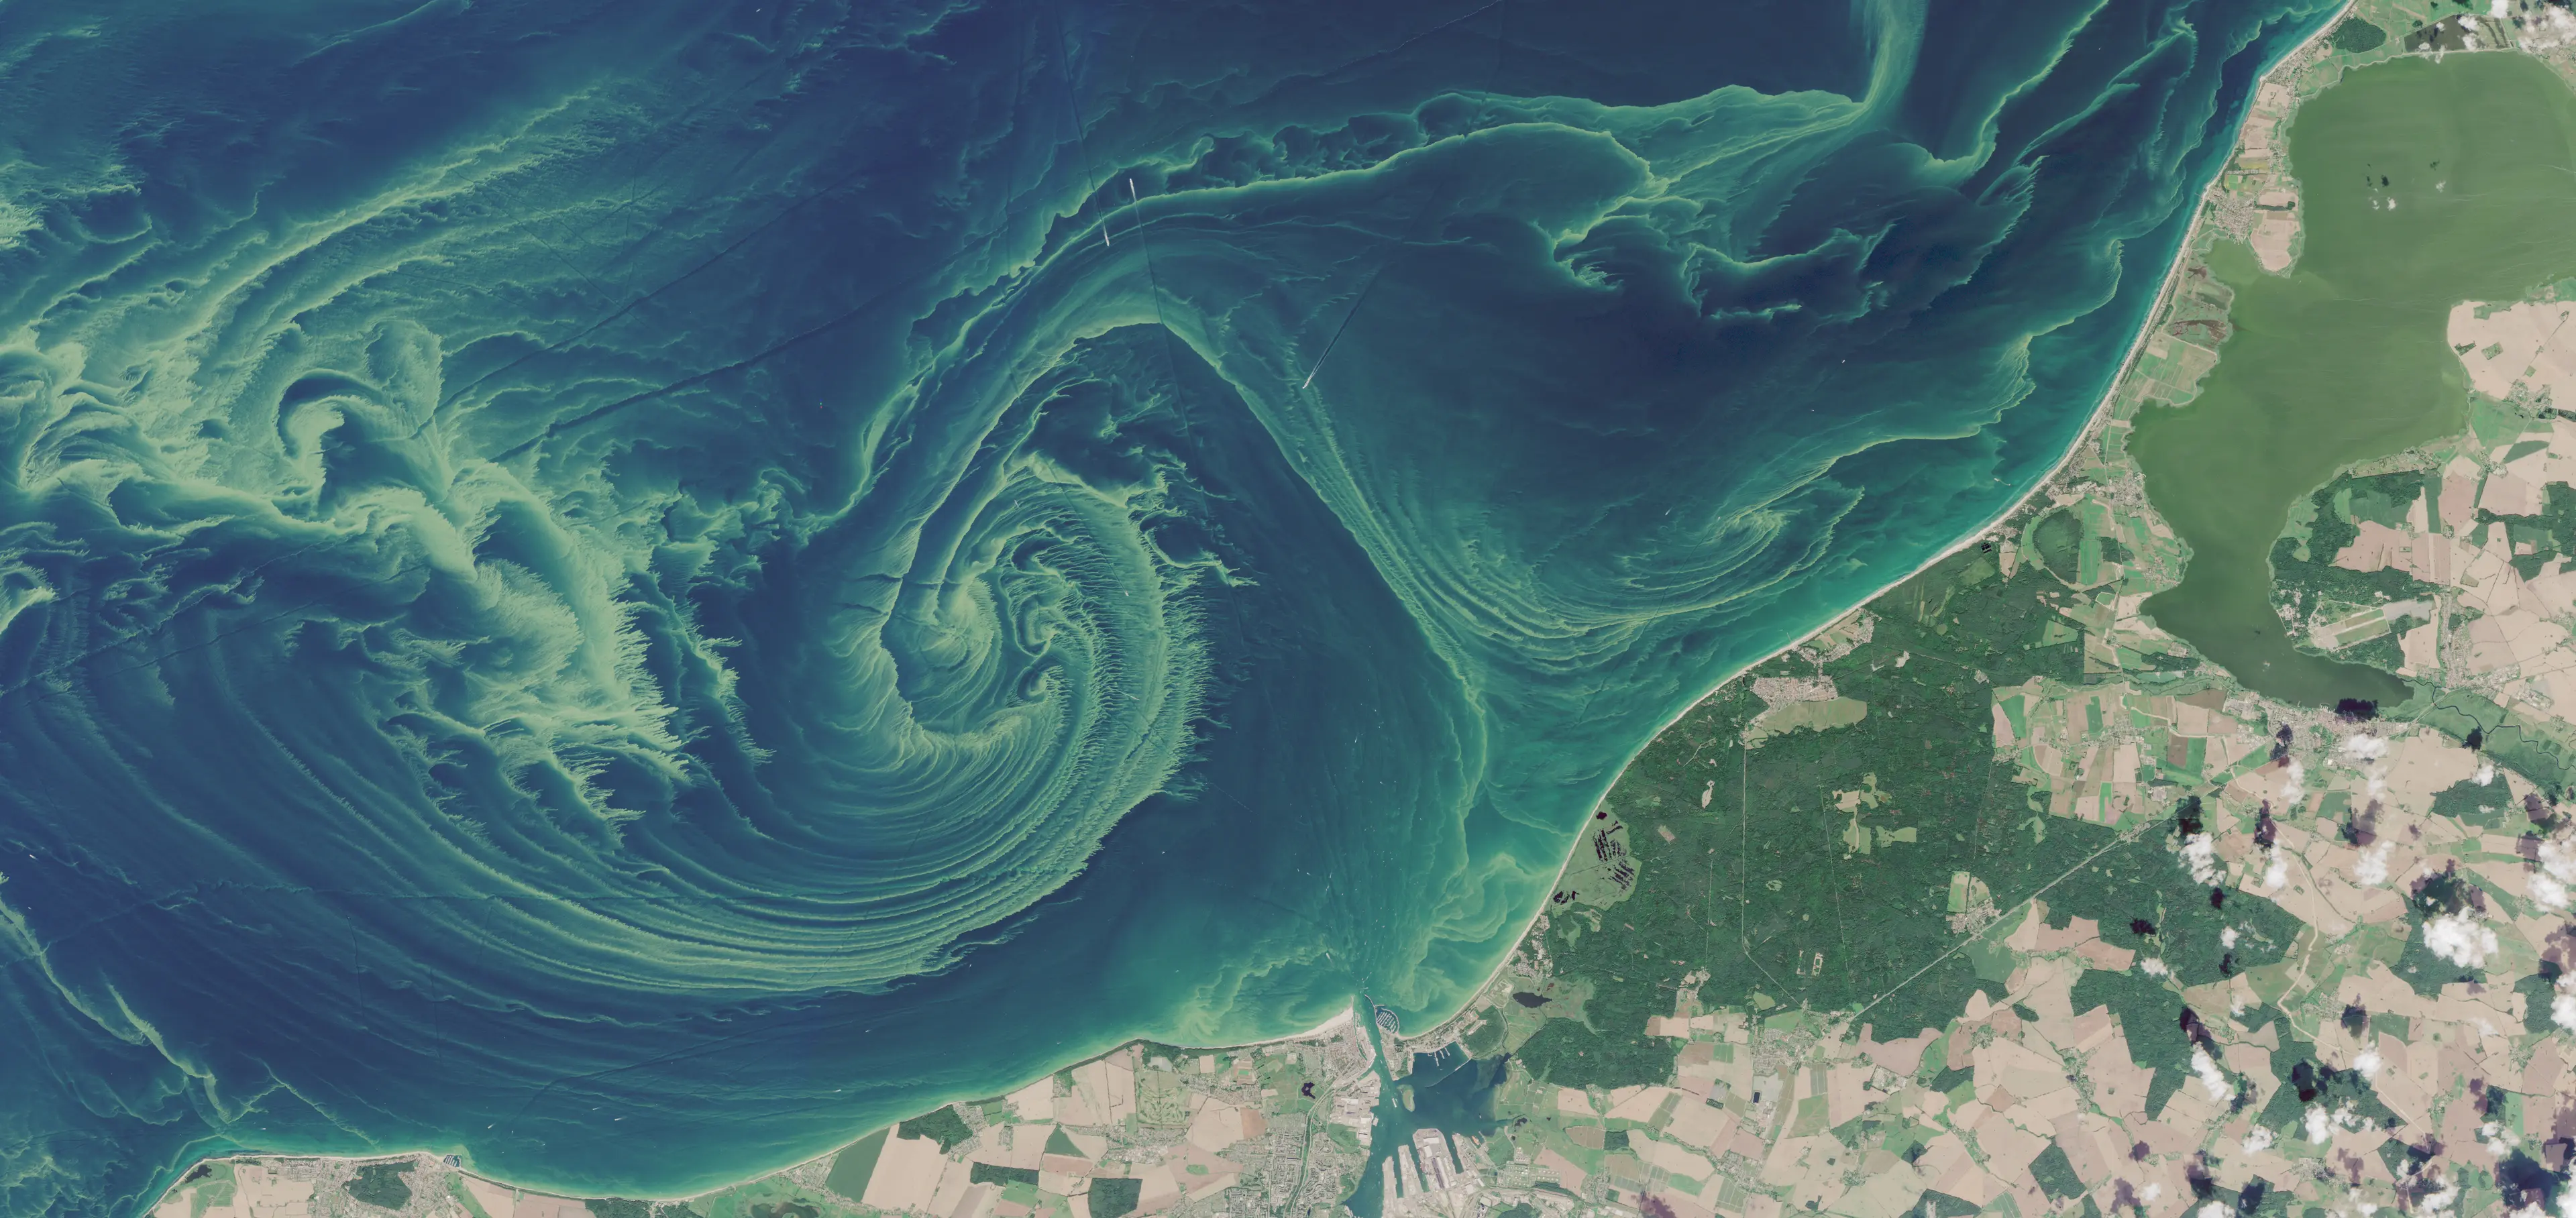
Sentinel-2 MSI, 8 August 2026. A severe cyanobacteria bloom off Rostock-Warnemünde. Contains modified Copernicus Sentinel data.
The team has also added a product that maps particulate organic carbon (POC). Chlorophyll-a is the usual stand-in for phytoplankton biomass. POC covers algal and non-algal organic matter, so it is less specific, but it can give a more direct measure of carbon where the ratio of chlorophyll to carbon shifts with conditions. Martin sees ecosystem managers, biogeochemists and carbon-cycle researchers as its users, helping them "to better assess organic carbon stocks and fluxes that are not captured by chlorophyll-a alone."
What a satellite cannot see
Martin is direct about the limitations. Optical satellites see only the upper layer of the water: no deeper than about 100 metres in very clear ocean water, and a few centimetres in very turbid water. They observe how the water's contents absorb and scatter light, and the team relates that to the water's other properties. "We do not directly observe nutrients, salinity, oxygen or pH."
Coastal and inland waters are the hardest; sediments and dissolved substances mix with the phytoplankton signal. "We do our best to deliver reliable results and associated uncertainties," he says. "We must openly communicate our limitations, even though we are constantly working to push these boundaries."
There are surprises too. At the moment he is interested in places where the seabed shows through the water, "as this completely undermines all our model assumptions." And clouds remain the oldest problem. "There are still many hidden mysteries of the seas, if only because when we want to study longer-term processes, there are constantly clouds in the satellite images."
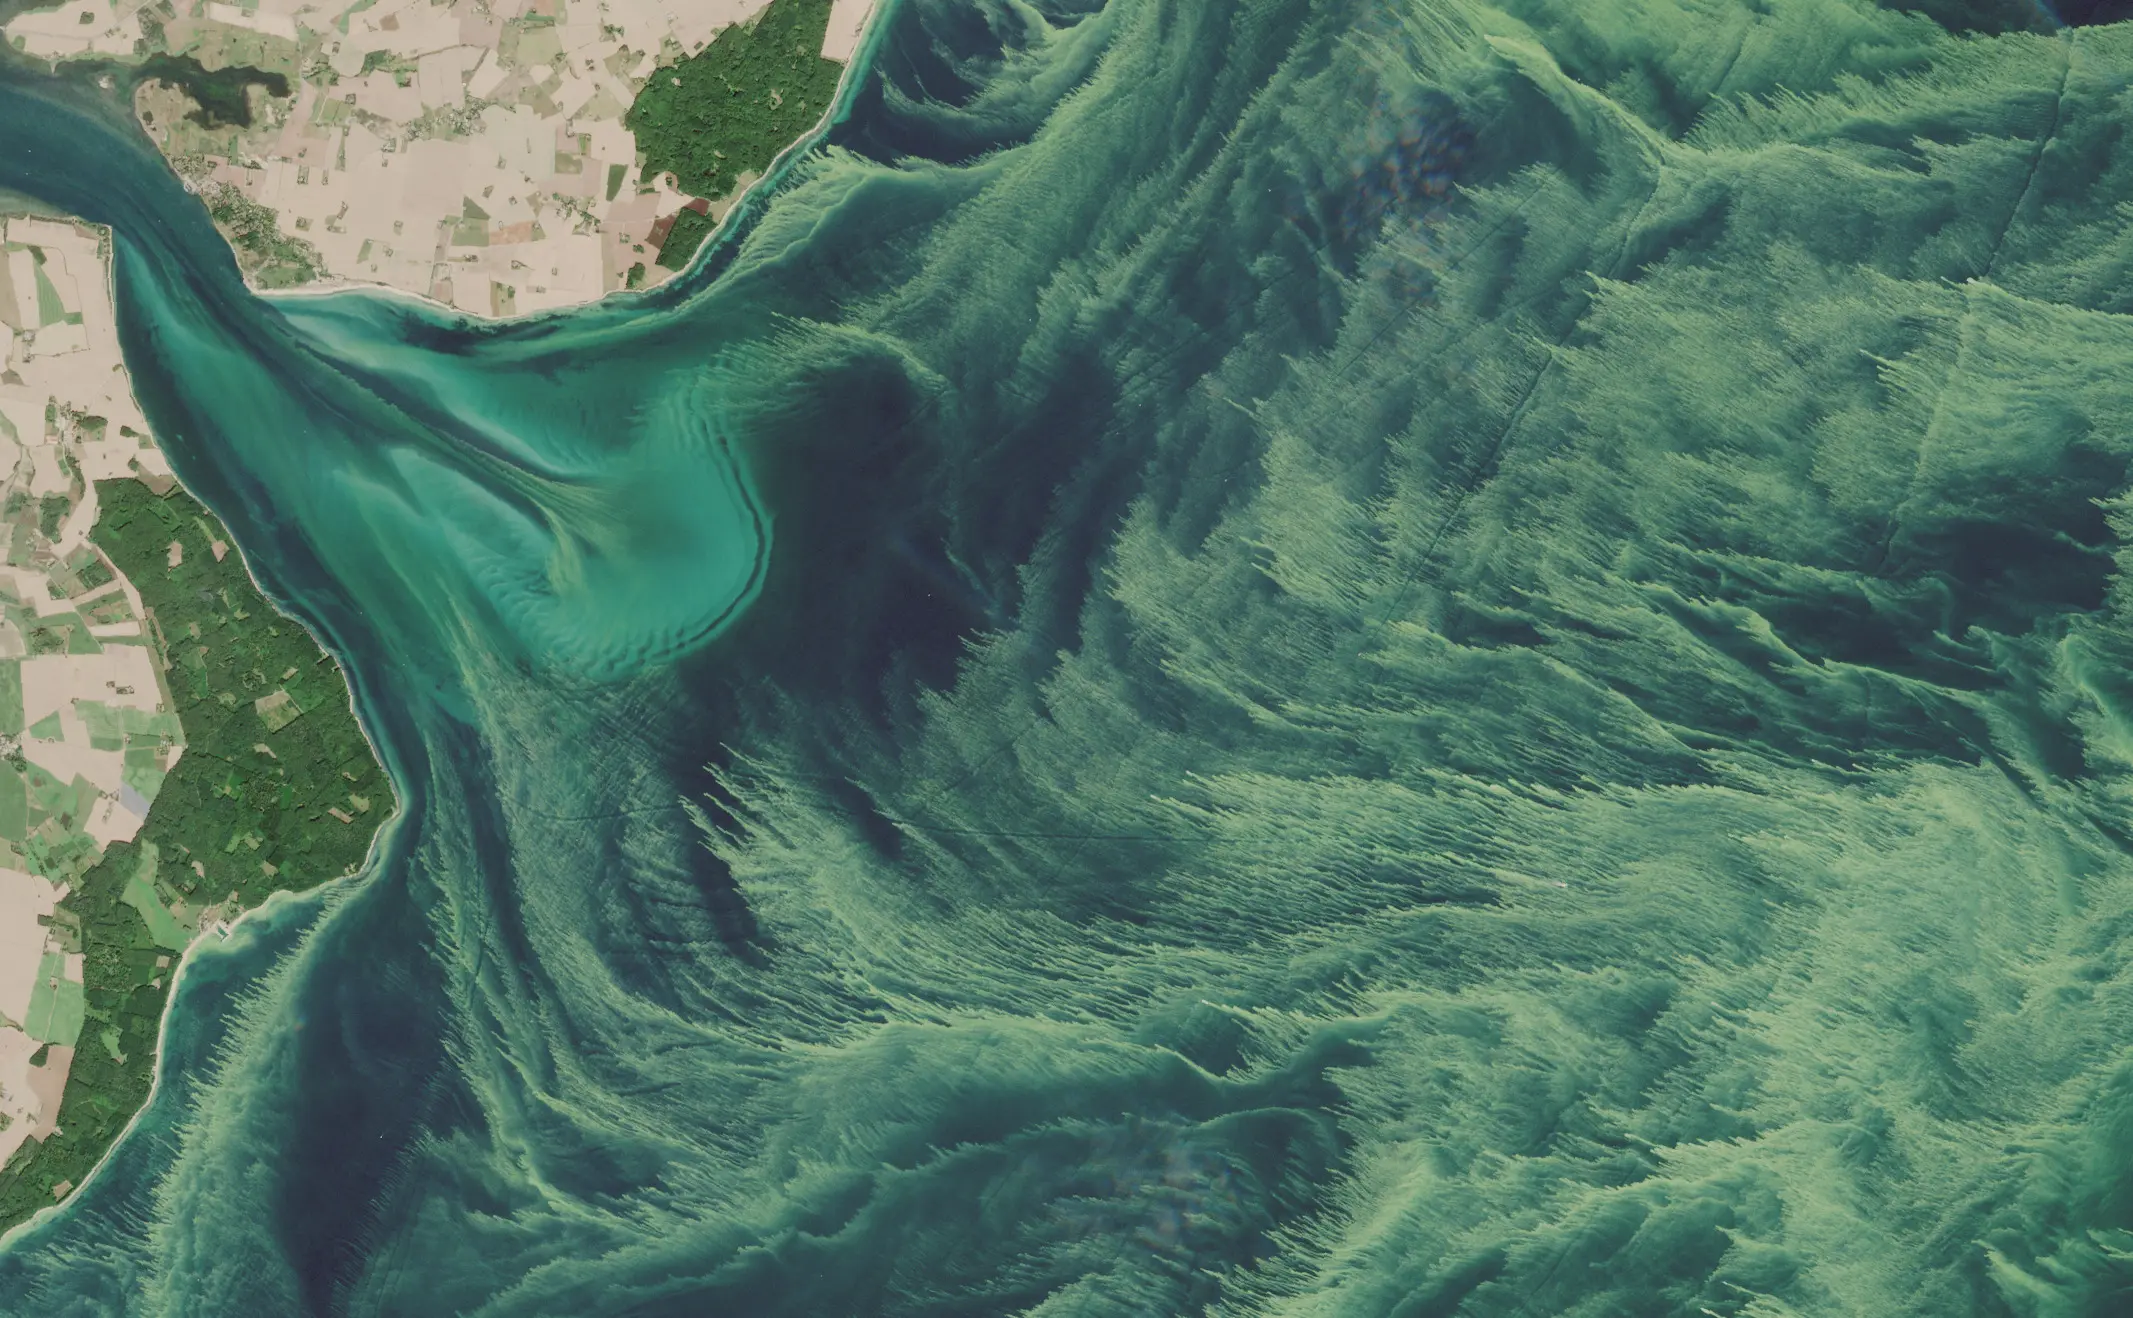
Sentinel-2 MSI, 13 August 2026. Bottom effects and dense cyanobacteria off the Danish island of Møn. Contains modified Copernicus Sentinel data.
After AquaINFRA ends in December 2026, the team has research ideas to follow up, some through a new network. The project has also changed how they work. It "has certainly highlighted aspects that we have not paid enough attention to so far, including data re-use and metadata description."
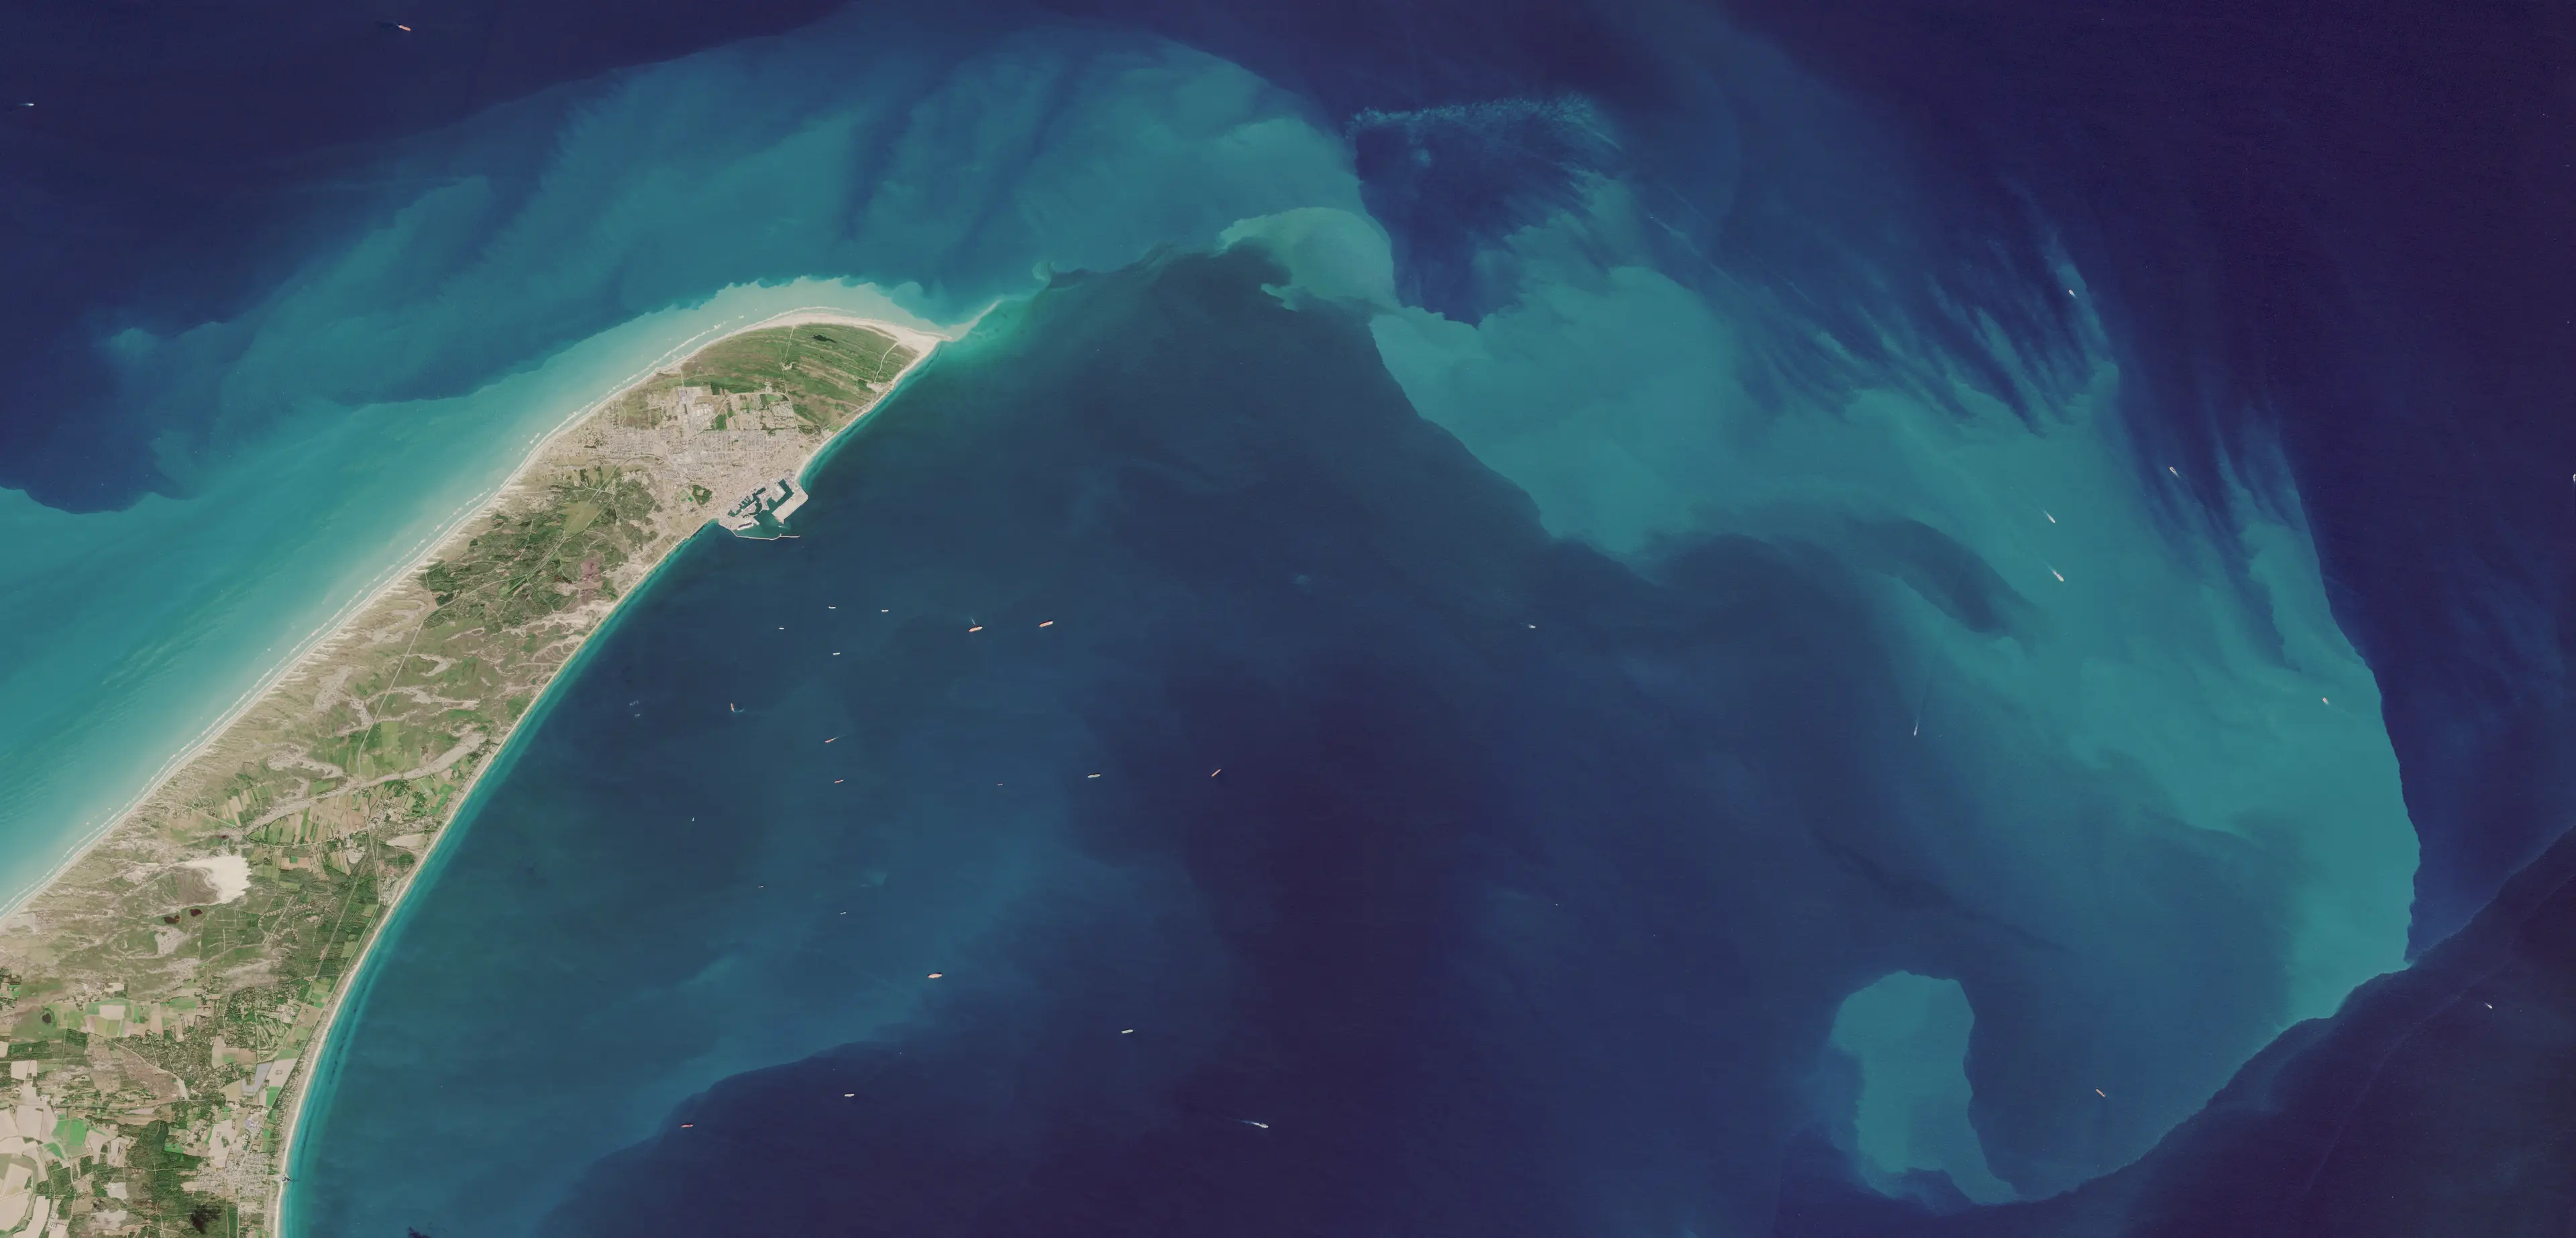
Sentinel-2 MSI, 16 August 2026. Skagen, Denmark, where the waters of the North Sea and the Baltic meet. Contains modified Copernicus Sentinel data.
Behind every striking satellite image, Martin says, sit satellite engineering, radiative transfer, biology, chemistry and physics, AI data processing, field validation and trend analysis. "A huge picture puzzle and a vast ocean."
Read the paper:
Hieronymi, M., Behr, D., Bi, S., and Röttgers, R.: Optical complexity of North Sea, Baltic Sea, and adjacent coastal and inland waters derived from Sentinel-3 OLCI satellite data, Earth Syst. Sci. Data, 18, 1307–1329, https://doi.org/10.5194/essd-18-1307-2026, 2026.